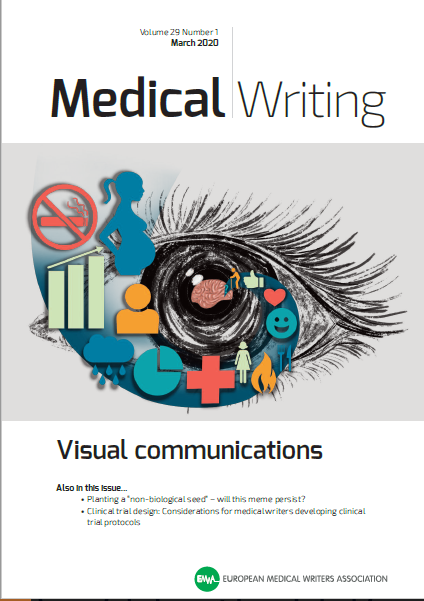
Volume 29, Issue 1 - Visual Communications
Leveraging infographics in study schemas
Authors: Leehee Navon-Perry, Jackie Raskind, Sara Stein
Abstract
Data disclosure requirements of the European Medicines Agency (EMA) and the U.S. Food and Drug Administration (FDA) mandate that protocols be shared on designated clinical trial websites. As a visual medium, the
internet is transforming the way these protocols are communicated to a global audience. Medical writers can use data visualisation to represent study schemas in protocols as infographics and in this way help readers to better understand multiple layers of complex information. Study schemas can be designed using standard tools such as Microsoft PowerPoint. Medical writers can use visual elements such as colour, shapes, and icons to portray timelines, dosage regimens, treatment arms, study periods, and procedures. This article describes key concepts in data visualisation and demonstrates how those concepts can be applied in designing creative, effective, and informative study schemas.
 Download the full article
References
- Desjardins J. How much data is generated each day? [Internet]. World Economic Forum. 2019 Apr 17 [cited 2020 Jan 21]. Available from: https://www.weforum.org/ agenda/2019/ 04/how-much-data-isgenerated- each-day-cf4bddf29f/.
- Potter MC, Wyble B, Hagmann CE, McCourt ES. Detecting meaning in RSVP at 13 ms per picture. Atten Percept Psychophys. 2014;76(2):270–9.
- Meyers PJ. Eye-Tracking Google SERPs – 5 tales of pizza [Internet]. Moz, Inc. 2011 Oct 5 [cited 2020 Jan 21]. Available from: https://moz.com/blog/eyetracking-googleserps.
- Nelson DL, Reed VS, Walling JR. Pictorial superiority effect. J Exp Psychol Hum Learn. 1976;2(5):523–8.
- Pictograms [Internet]. Olympic Games Museum. Olympic Games 1964 Tokyo. 1964 [cited 2020 Jan 31]. Available from: http://olympic-museum.de/pictograms/ olympic-games-pictograms-1964.php.
- SVG Repo [Internet]. Medical collection SVG vectors. Available from: https://www. svgrepo.com/vectors/medical-collection/.
- Grear M. Inside/Outside: From the basics to the practice of design. 2nd ed. Berkeley: New Riders; 2006.
- Koffka K. Principles of Gestalt Psychology. London: Routledge; 1955. p. 176.
- Lupton E, Cole Phillips J. Graphic design: The new basics. 2nd ed. New York: Princeton Architectural Press; 2015. p. 102.
Search
Articles
Links
Editoral Board
Editor-in-Chief
Co-Editors
Managing Editor
Victoria White
Deputy Managing Editor
Alicia Brooks Waltman
Associate Editors
Section Editors
AI/Automation
Biotechnology
Digital Communication
EMWA News
Gained in Translation
Getting Your Foot in the Door
Good Writing Practice
In the Bookstores
Publications
Medical Communications/Writing for Patients
Medical Devices
My First Medical Writing
News from the EMA
Freelancing
Pharmacovigilance
Regulatory Matters
Regulatory Public Disclosure
Teaching Medical Writing
Louisa Ludwig-Begall / Sarah Kabani
The Crofter: Sustainable Communications
Veterinary Writing
Editors Emeritus
Layout Designer
Chris Monk
 Visit the EMWA website